


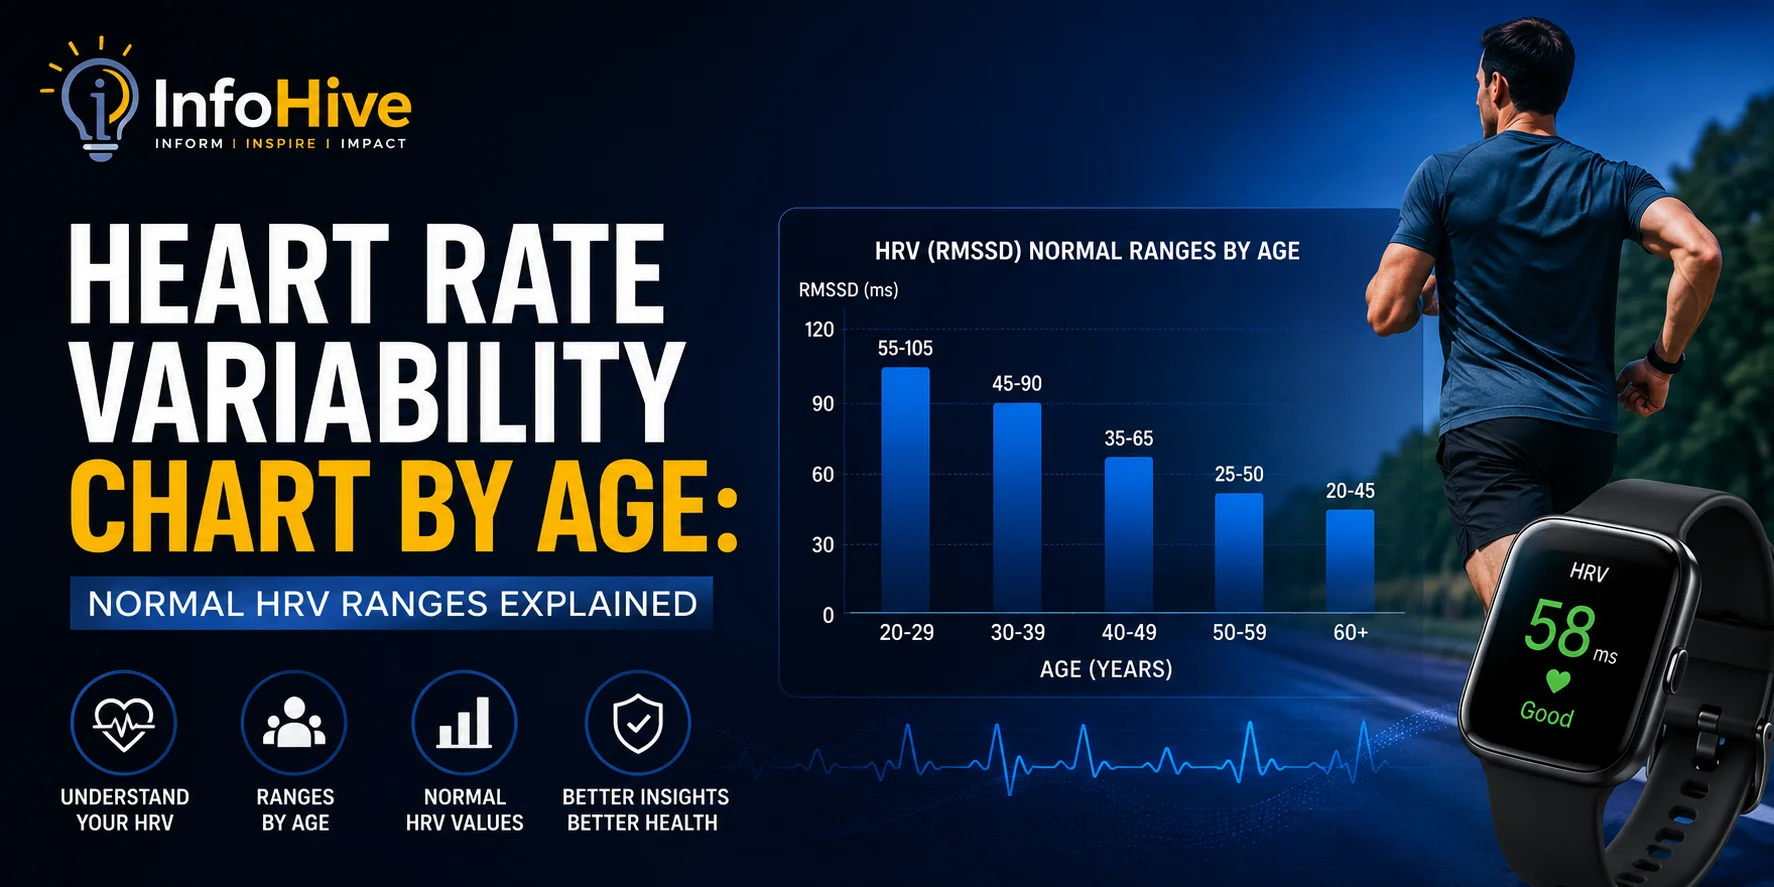
Most people check their heart rate and move on with their day. Fewer people know that a completely different number, hiding inside that same heartbeat, tells a much bigger story about their nervous system. That number is heart rate variability, and once you start tracking it, a single question always comes up. Where do I actually stand compared to people my own age? This heart rate variability chart by age breaks that down clearly, using real research and device data instead of guesswork.

What HRV Is Actually Measuring
Your heart doesn’t beat like a metronome. It speeds up a bit when you breathe in. Slows down a bit when you breathe out. That small gap between beats is the whole thing. That’s HRV. HRV meaning explained in the simplest terms, it’s this constant push and pull, run by your autonomic nervous system.
Higher variability usually points to a body that moves easily between stress and recovery. Lower variability often means the nervous system stays leaning toward stress even on a day that feels fine on the surface. That’s why this metric caught on so fast with fitness trackers.
Why It Drops as You Get Older
Nobody explains this part well enough, honestly. HRV goes down with age. Not because you did something wrong. Mostly biology.
Pacemaker cells in the heart lose some sharpness over the decades. Baroreflex sensitivity weakens too — that’s how quickly your body reacts to blood pressure shifts. Both of these narrow the window HRV depends on in the first place. Then lifestyle stacks on top of that. Years of accumulated stress. Sleep that tends to get worse through midlife. Less daily movement than in your twenties. All of it drags parasympathetic tone down further.
There’s a genuinely good part here though. None of this is locked in. People who sleep well, stay active, actually manage their stress — they often sit well above the average for their age bracket.
The Actual Numbers, by Age
Platforms measure slightly differently, but the overall shape stays the same no matter which dataset you look at.
Wearable data from large user bases shows a clear downward slope. Twenty-somethings usually fall somewhere between 55 and 105 on the RMSSD scale. That range tightens through the thirties, often averaging near 60. Mid-forties tends to sit around 48. Mid-fifties drops closer to 44. People between 60 and 65 commonly land between 25 and 45.
Clinical research shows something similar but wider, since it includes both athletes and sedentary people in the same pool. Multiple published studies put the normal HRV range for healthy adults somewhere between 19 and 75 milliseconds, younger adults toward the top end, older adults toward the bottom.
Rough breakdown by decade: twenties land around 55 to 105. Thirties narrow to roughly 45 to 90. Forties settle near 35 to 65. Fifties sit closer to 25 to 50. Sixties often fall between 20 and 45.
None of these are hard cutoffs, just reference points built from averages. Your own number can sit outside these ranges and still be perfectly healthy for you.
Does Gender Actually Change Things
A little. Less than people assume though. HRV by age and gender data shows women aged 20 to 35 tend to average slightly higher RMSSD than men the same age. That gap narrows through midlife. Mostly gone by 55.
If the chart you’re comparing yourself against lumps everyone together regardless of gender, it might not reflect your real baseline all that well. Your own trend over time still beats a one-off comparison against some generic average.
So What’s Actually a Good Score
Everyone wants one clean number. The honest answer is messier than that. What is a good HRV score depends on your age, your fitness, your genetics, and the baseline you’ve built up over weeks of actually tracking it.
A competitive 25-year-old athlete might sit above 100. A healthy, active 55-year-old averaging 45? That’s exactly where they should be. Comparing those two side by side tells you almost nothing useful at all.
Your own rolling 30-day average matters way more here. Watch for shifts away from that. Not how you stack up against a total stranger.
RMSSD Versus SDNN — What’s the Difference
Most charts lean on one of two core metrics. Knowing which is which helps you actually read your own numbers right.
RMSSD normal range figures come from short bursts of heartbeats, usually captured overnight during sleep. Wearables like WHOOP and Oura lean on this one since it reflects parasympathetic activity — basically the recovery side of the nervous system.
SDNN normal range figures come from a longer window instead, sometimes a full 24 hours. It captures both sympathetic and parasympathetic activity together, which is part of why clinics and researchers tend to prefer it over daily consumer tracking apps.
Neither one is objectively better than the other. They just measure different things. A solid chart should tell you which one it’s actually using.
What Else Pulls a Score Down
Age explains part of it. Not all of it. Low HRV causes go well past natural aging alone.
Poor sleep is probably the biggest one. Deep sleep is exactly when parasympathetic activity peaks, after all. Chronic stress — work pressure, unresolved anxiety, whatever the source — keeps the sympathetic nervous system switched on longer than it should be. Illness and inflammation, even something as small as a cold, temporarily drag HRV down while the body redirects energy toward fighting it off. Alcohol the night before almost always shows up as a lower reading come morning. Dehydration. Overtraining without proper rest days. Irregular sleep timing. It all adds up eventually.
The Stress Connection Most People Already Feel
HRV and stress levels are tightly linked. That’s exactly why so many wellness apps built entire dashboards around this single number. When the body senses a threat — real or entirely imagined — the sympathetic nervous system takes over and heart rhythm gets more regular, less variable. Stay in that mode too long without real recovery, and HRV stays suppressed even on days when nothing dramatic is technically happening.
That’s why people going through a rough stretch at work, or dealing with bad sleep for weeks, often watch their HRV drift downward slowly. No single trigger to point at. Just a gradual slide.
How a Reading Actually Gets Taken
A heart rate variability test looks different depending on where it happens. Clinical settings usually rely on a resting ECG over several minutes in a controlled room. Wearables like WHOOP, Oura, and Garmin instead calculate HRV continuously overnight through optical sensors, capturing data during your deepest sleep stages when the nervous system sits at its most stable point.
Some people prefer dedicated HRV tracking devices, or a phone app paired with a chest strap, taking one quick reading seated and resting each morning. How consistently you measure matters more than which exact method you pick. A morning reading and an evening one simply look different, regardless of how healthy you actually are underneath.
Where You Land on the Percentile Scale
An HRV percentile chart goes a step further than a plain average. It shows exactly where your number ranks against others in your specific age and gender bracket, instead of just comparing you to one midpoint figure.
Sitting somewhere in the middle fifty percent for your bracket is a normal, unremarkable baseline. Consistently below the tenth percentile, especially paired with an elevated resting heart rate, usually gets flagged by clinicians as worth a closer look. Well above the ninetieth percentile often lines up with strong fitness, solid recovery habits, or honestly sometimes just a favorable starting point genetically.
Raising Your Score, Naturally
Research backs up something reassuring here. HRV responds to lifestyle changes at pretty much any age, no matter where you’re starting from.
A consistent sleep schedule — same bedtime, same wake time — tends to lift HRV within a few weeks. Regular moderate exercise builds parasympathetic tone over time, though pushing too hard without rest days can work against you instead of for you. Cutting back on alcohol, even just a couple nights a week, often shows up as a visible bump in your morning numbers. Basic stress management, slow breathing exercises, a short daily mindfulness habit, has real measurable backing across multiple studies now. Staying hydrated and eating reasonably well rounds out the rest of it.
When a Drop Is Actually Worth Worrying About
One low reading, on its own, rarely means anything. HRV bounces around daily based on sleep, stress, alcohol, minor illness, even how hydrated you were the night before.
What actually matters is a sustained downward trend over several weeks with no obvious lifestyle reason behind it. If your score consistently sits below the lower end for your age group, and that’s paired with other signs like an elevated resting heart rate or ongoing fatigue, that’s worth mentioning to a doctor. Not something to try and diagnose off a chart alone.
Frequently Asked Questions
What’s considered normal HRV for my age?
It varies quite a bit, but research generally shows a drop from around 55–105 milliseconds in your twenties down to roughly 20–45 by your sixties.
Is a higher HRV always the goal?
Usually, yes. It points to a nervous system shifting easily between stress and recovery. Context still matters though — your own baseline means more than chasing the highest possible number out there.
Can lifestyle changes actually move the number?
Yes. Better sleep, regular exercise, less alcohol, consistent stress management — all of it shows measurable improvement within weeks in most studies.
Does gender change things much?
A little. Women average slightly higher in early adulthood. That gap mostly closes by 55 though.
Should one low reading worry me?
Not really. Single dips happen all the time, usually tied to poor sleep, alcohol, or minor illness. A sustained downward trend is what actually deserves attention.
Final Thoughts
A heart rate variability chart by age works best as a reference point. Not something to obsess over. The pattern holds across basically every major dataset out there — HRV tends to peak in your twenties, then declines gradually through each decade after that, shaped by biology and everyday habits working together. What matters more than comparing yourself to some stranger’s number is watching your own trend, figuring out what pushes it up or down, and building habits around that. Whatever age you’re starting from.